Tektronix customers during the late 1960’s and early 1970’s requested a direct digital data stream of measurements made by the signals coming into oscilloscopes. One of Hale Farley's assignments at Sandia National Labs was digitizing photographs from oscilloscopes generated by nuclear events. It was a slow and difficult job but essential for computer analysis. Bob Hightower submitted a field report for Hale in 1970 to get direct read out in digital form instead of photographs.
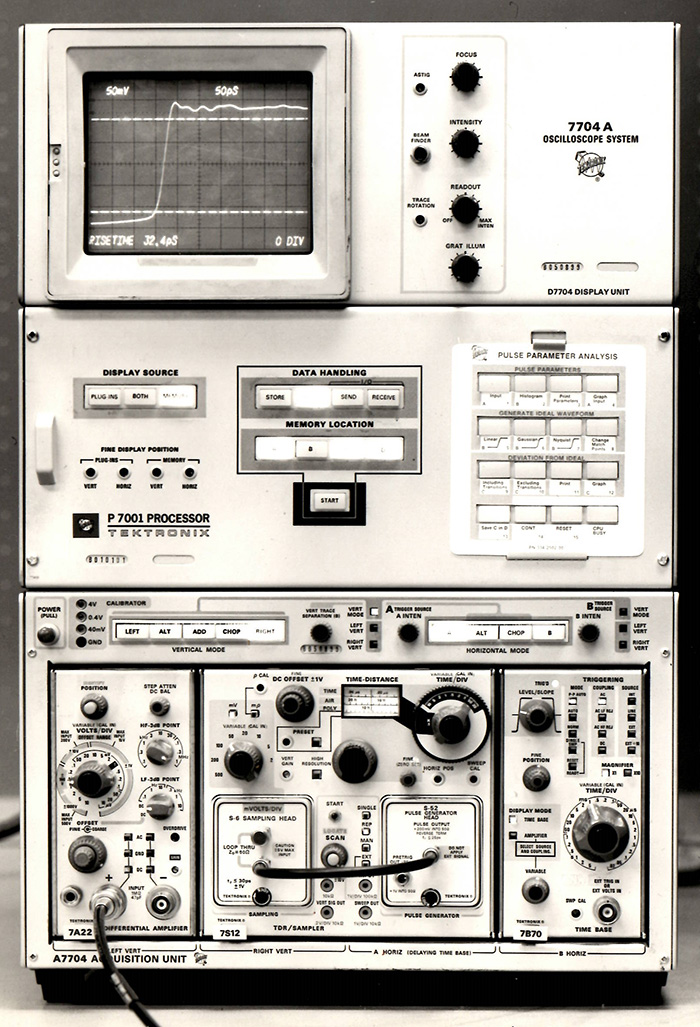
Tektronix response was the P7001 Processor which was integrated into the 7704A between the upper display unit and the lower acquisition unit. It was introduced in March 1973. These images are from the market introduction slides created by Dr. Jay Snell, the marketing manager for the product.
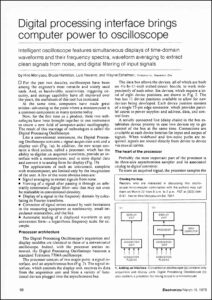
This March 15, 1973 issue of Electronics has an article on the Digital Processing Oscilloscope. Click on the image to view the PDF.
Hale Farley and Holger Lübben collaborated to create this description of the operation of the P7001 using the original marketing slides.
Several advances were achieved in P7001, one was the use of core memory for storing wave forms. Using a single A/D the waveform was digitized and stored in the core memory. There were four waveform storage locations in the P7001. If power was lost the core memory would retain the information stored (later versions used volatile semiconductor memory). Several math functions were included in the P7001. The P7001 contained several on-board math functions which would use the 7704A to display the results without connection to a computer. For this application only functions are needed, Average and Graphic. A major additional function added to Tek DPO Basic was a fast Fourier transform (FFT) equations generated by Lyle Ochs and coded by Paula Ochs in such a way it was easy to export into other platforms. Due to the large memory using this function a separate overlay program would need to be loaded.
The software was Tektronix DPO Basic. This software was chosen because electronic engineers were interested in waveform analysis not in the scientific analysis which needed a mainframe computer. The processed waveform could then be used mainframe computer scientific analysis. That would have been a major selling point.
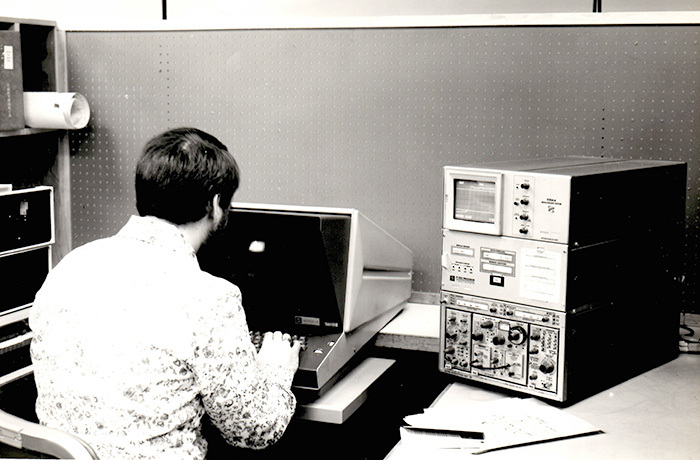
Let’s look at the example waveform used in these slides starting with the captured pulse and continue with the pulse parameter analysis stored in P7001. All of these images show different steps of the program "Pulse Parameter Analysis" and were taken in two slightly different runs of the program. The 7704A/P7001 was typically used with a minicomputer and graphic terminal.
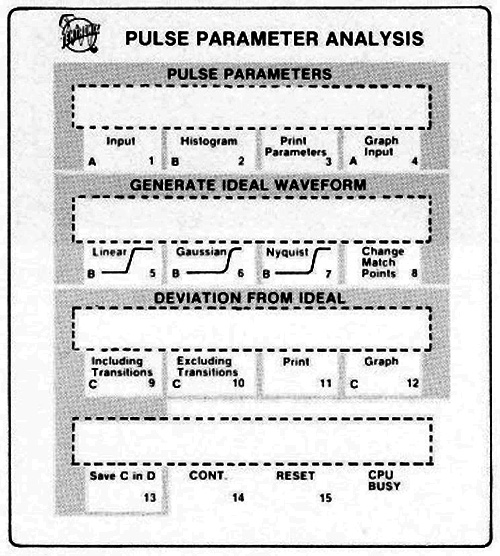
A keyboard overlay for the Pulse Parameter Analysis program indicates the various keys used.
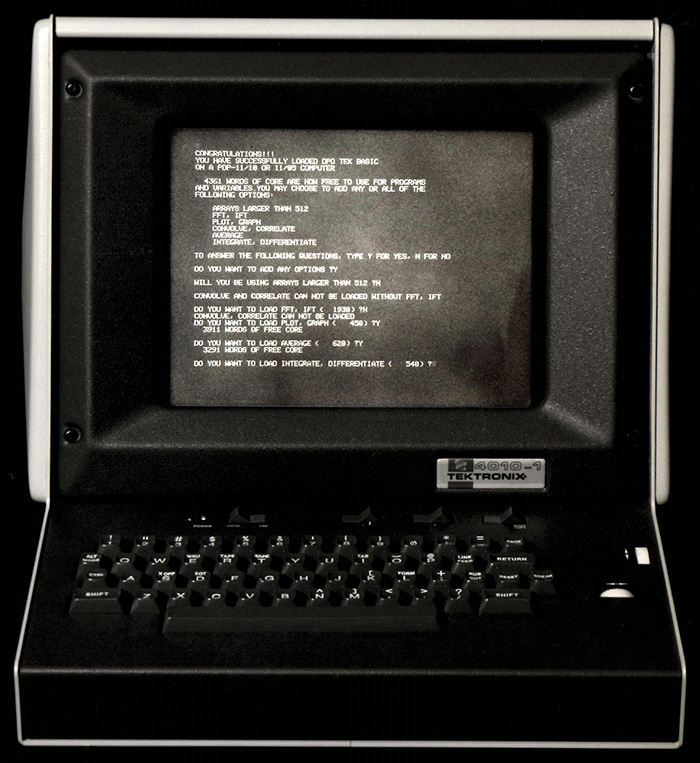
The 4010 graphics terminal displays the boot sequence/messages of the attached minicomputer. The first 3 lines show the loading message of TEK DPO BASIC. Since the memory was limited not all commands were loaded by default. The user had to answer some questions about the needed commands. Pulse parameter analysis needs the AVERAGE and GRAPHICS commands. FFT and IFT functions were integrated as BASIC commands but required large amounts of the memory so the user had the choice to load them. The FFT/IFT/INTEGRATE/DIFFERENTIATE and LARGE ARRAYS are not needed for this program.
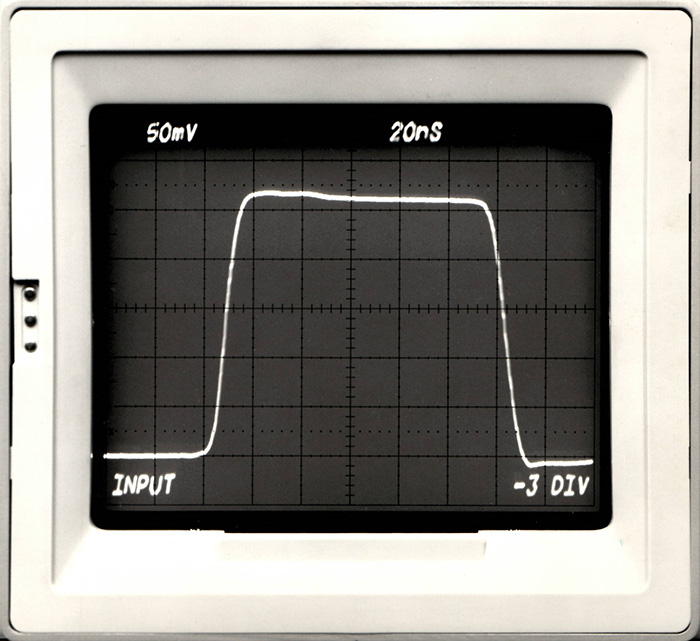
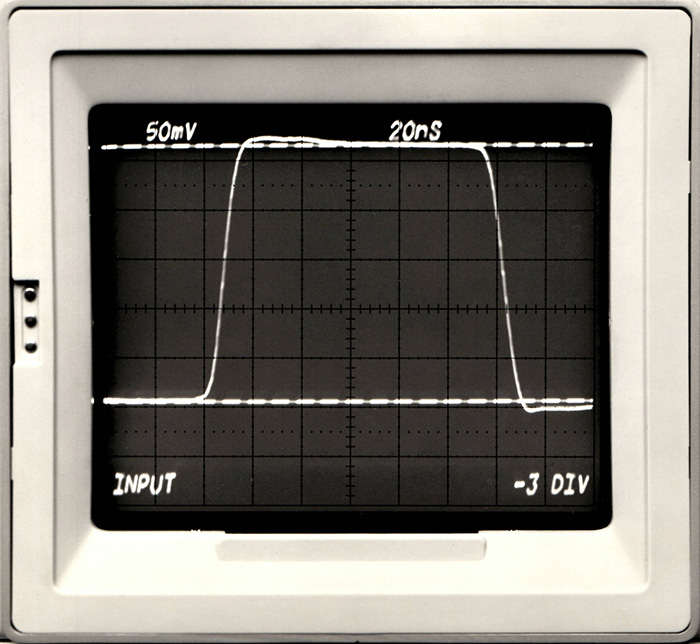
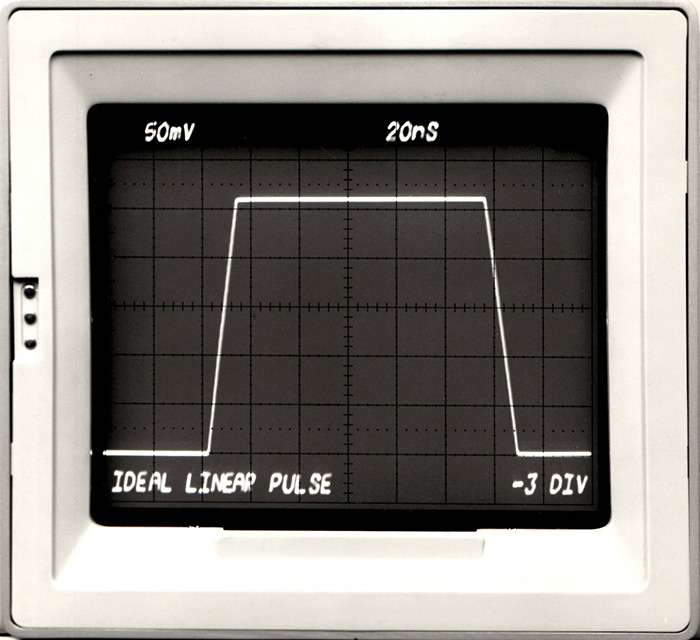
This image shows the input pulse which was digitized multiple times by the P7001 and averaged by the minicomputer. This was done by pressing button 1 of the user keys using the overlay card. The resulting waveform was used as the input pulse for the program. The zero reference is at -3 DIV from the center line.
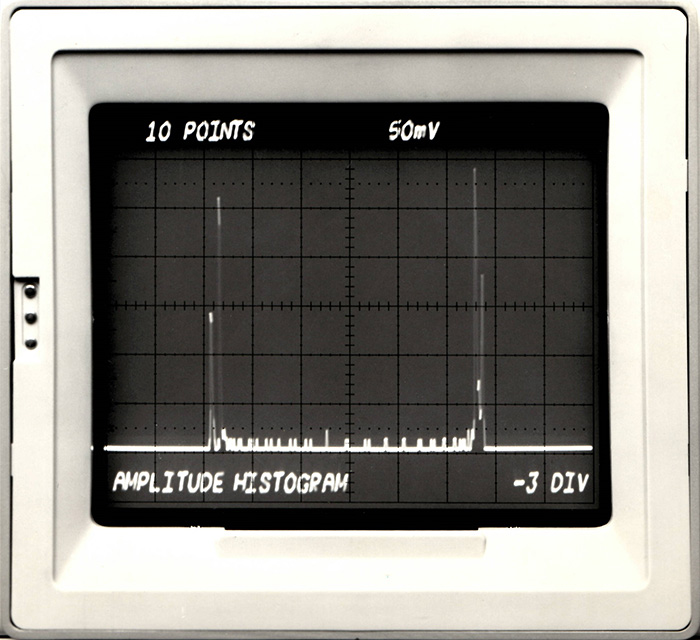
The amplitude histogram of the digitized pulse is calculated by pressing button 2. The two bigger vertical spikes represent 0% and 100% of the waveform.
Now the user presses buttons 5 - "calculate ideal linear pulse". The system starts the calculation and the DPO automatically displays the following intermediate steps. The 0% and 100% values of the amplitude histogram are displayed as dotted horizontal lines. These two values were then used to calculate the vertical 10%, 50% and 90% values of the waveform. These values were also used to calculate all the waveform parameters like rise- and fall time.
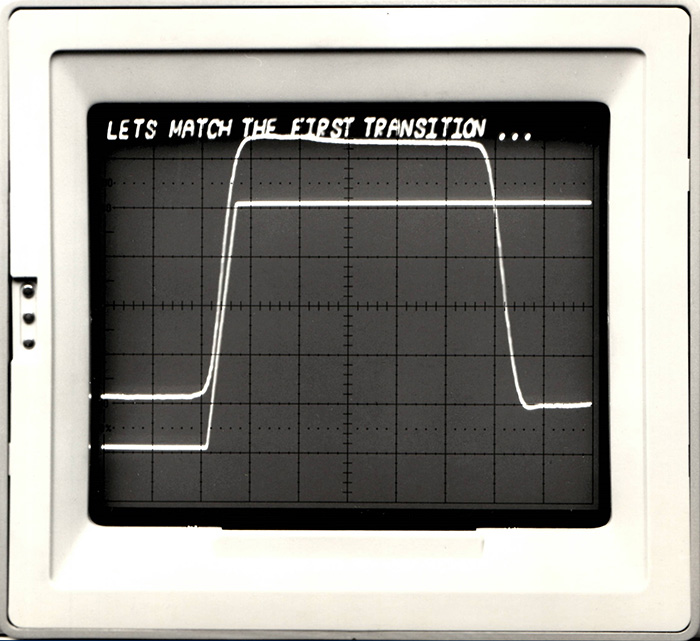
Based off these results the first transition of the pulse is calculated. This is done internally in a coordinate system which runs from -1 to 1 in all dimensions.
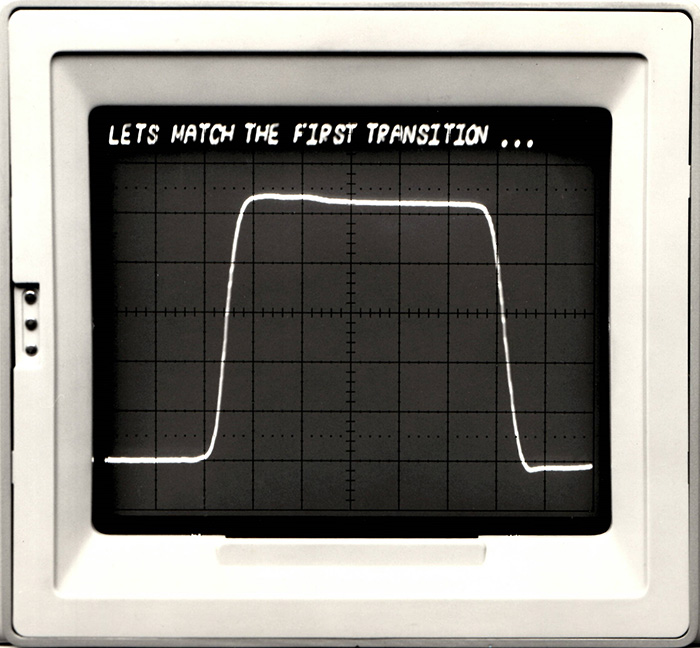
The program has now calculated the first transition. There are no scale factors displayed because the two visible waveforms use different coordinate systems.
The program has now calculated the second transition and displayed in the same way. The next step is to transform the results of the -1,1 coordinate systems back to the real world scale factors. The screen now shows the result of calculating the second transition and displays the message for the next step.
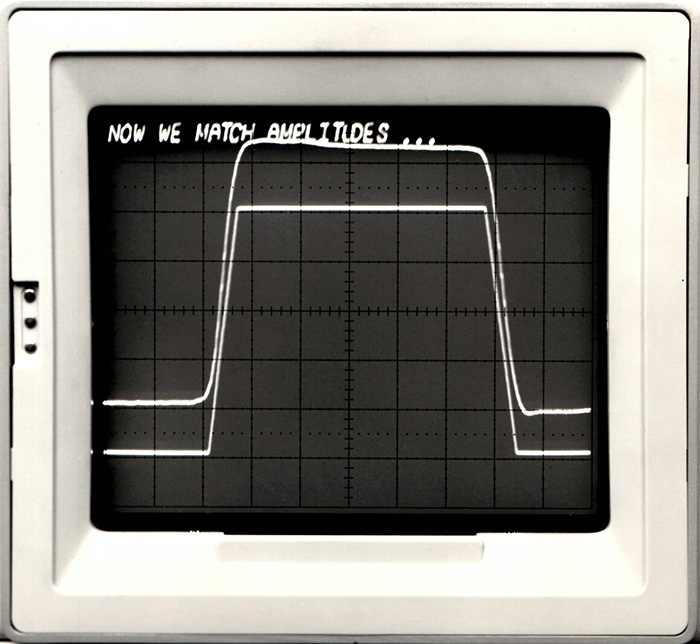
The screen shows the calculated transitions converted back to the real-world scale factors. The offset now has to be calculated in the next step.
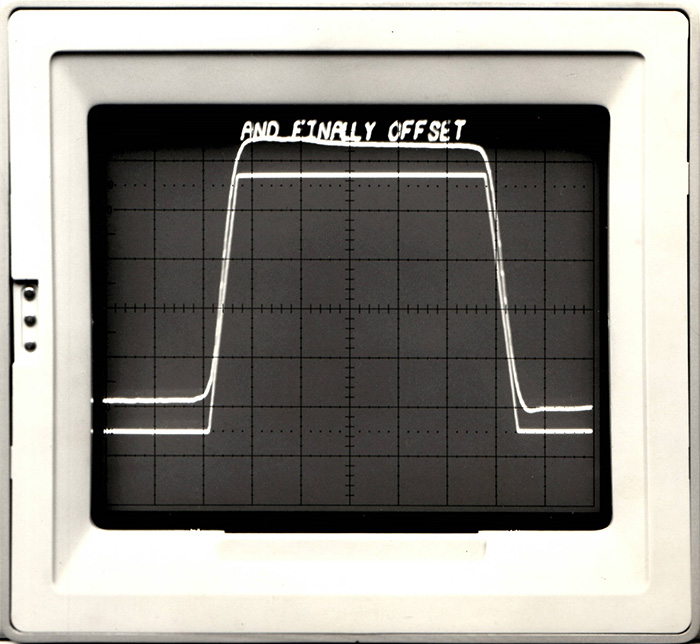
The screen now shows the result of all the previous steps. The calculated ideal pulse is now in the correct coordinate system and the scale factors are displayed again.
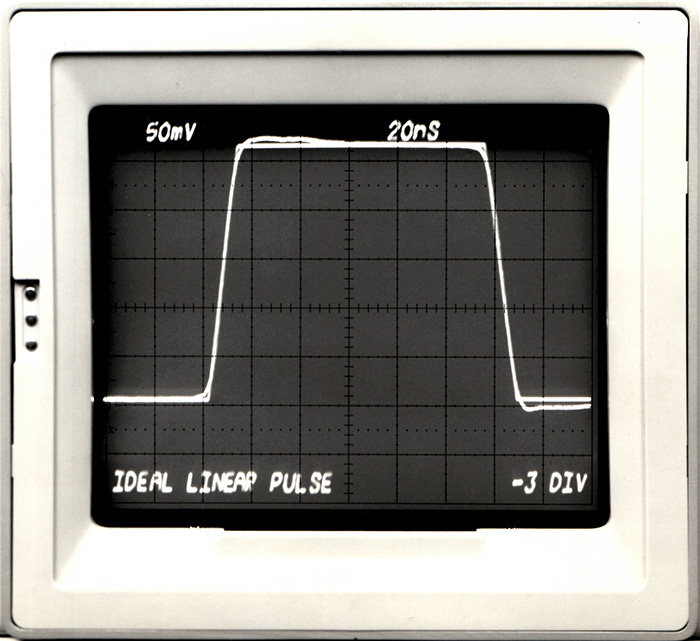
The screen now shows the original pulse with the calculated ideal pulse. This completes the button 5 "calculate ideal linear pulse" operation.
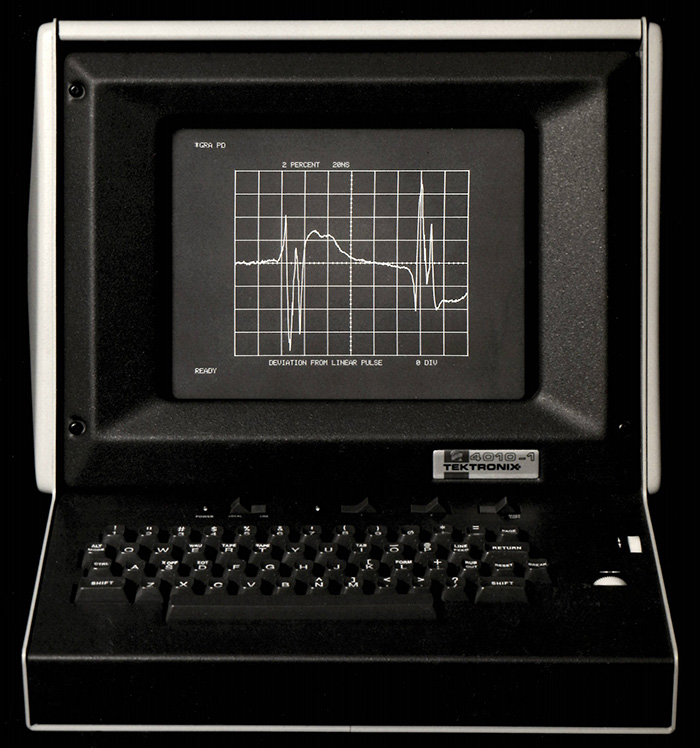
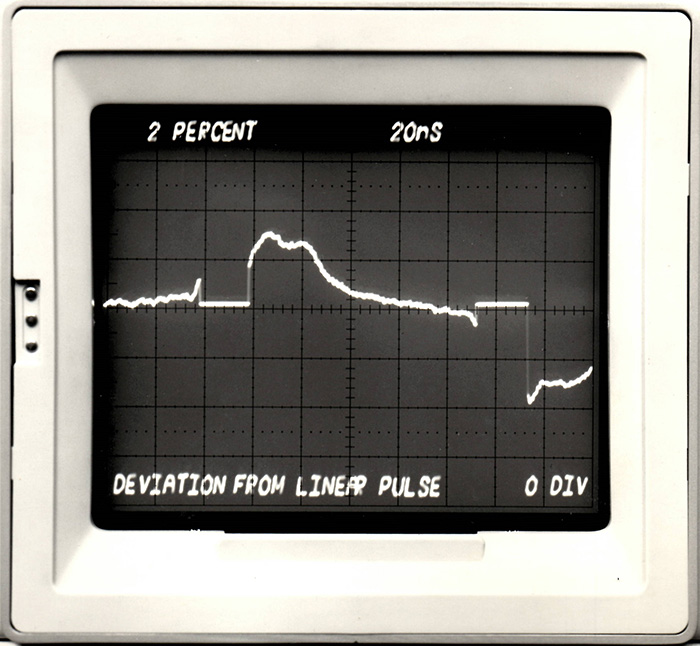
The user can then calculate several additional parameters. Pressing button 9 calculates the deviation of the ideal pulse to the original pulse including the transition areas. The transition areas contain the larger errors.
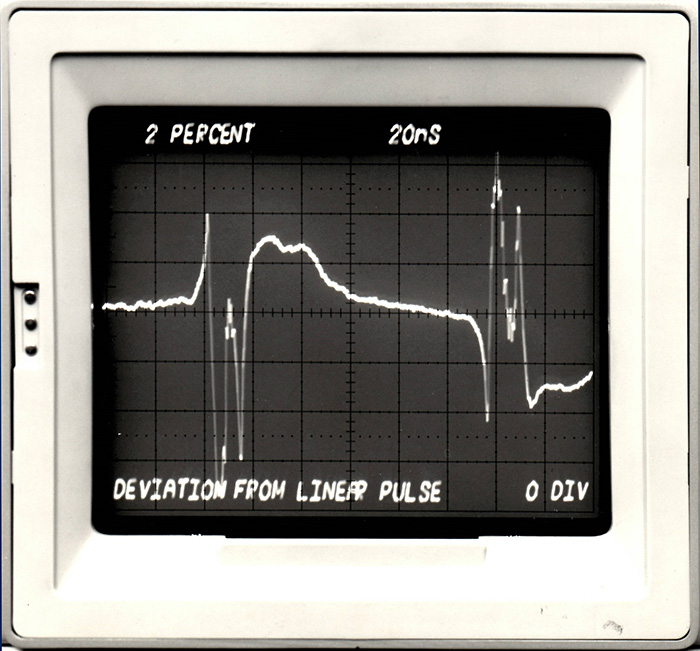
The output can also be displayed on the 4010 graphics terminal and a hard copy made.
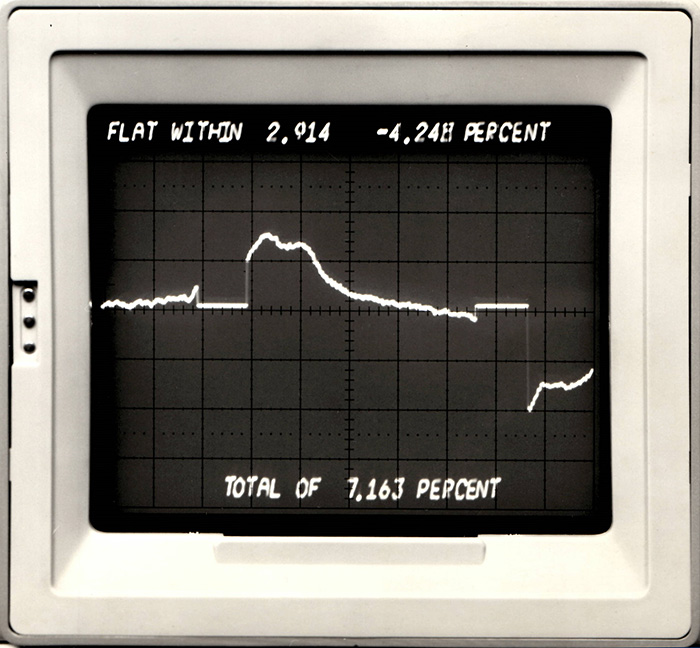
Pressing button 10 calculates the deviation of the ideal pulse excluding the transition areas resulting in a smaller error.
Additional calculations can be made around the deviation with excluded transitions.
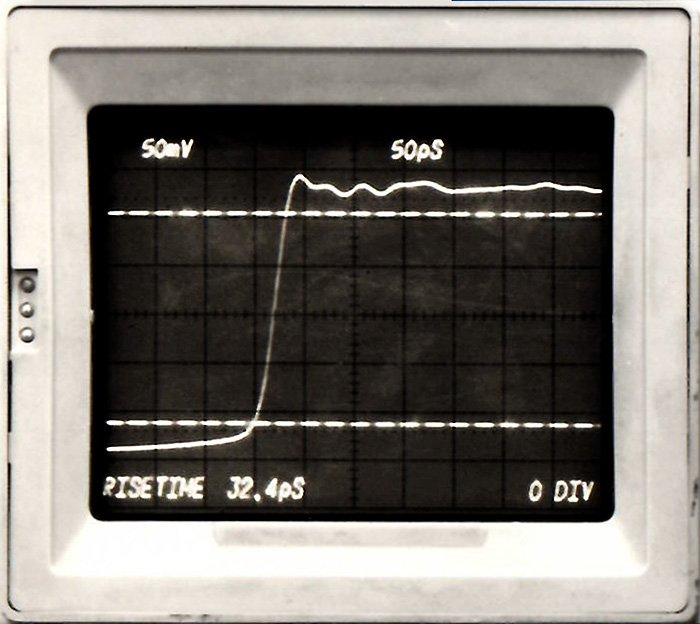
This display from the 7704A/P7001 oscilloscope image (top) shows the the 10% & 90% levels and rise time of a single transition waveform.
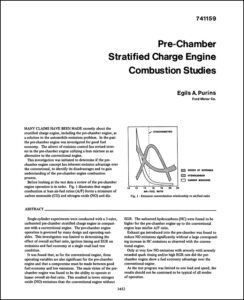
This Pre-Chamber Stratified Charge Engine Combustion Studies article by Egils A. Purins of the Ford Motor Company details the type of analysis that could be done using the capabilities of the P7001. Click on the image to view the PDF.
Holger Lübben developed a P7001 demonstration for the museum. He has designed a card for the P7001 to replace the minicomputer interface with a USB interface so we may use more modern (and smaller) hardware for our Digital Processing Oscilloscope.
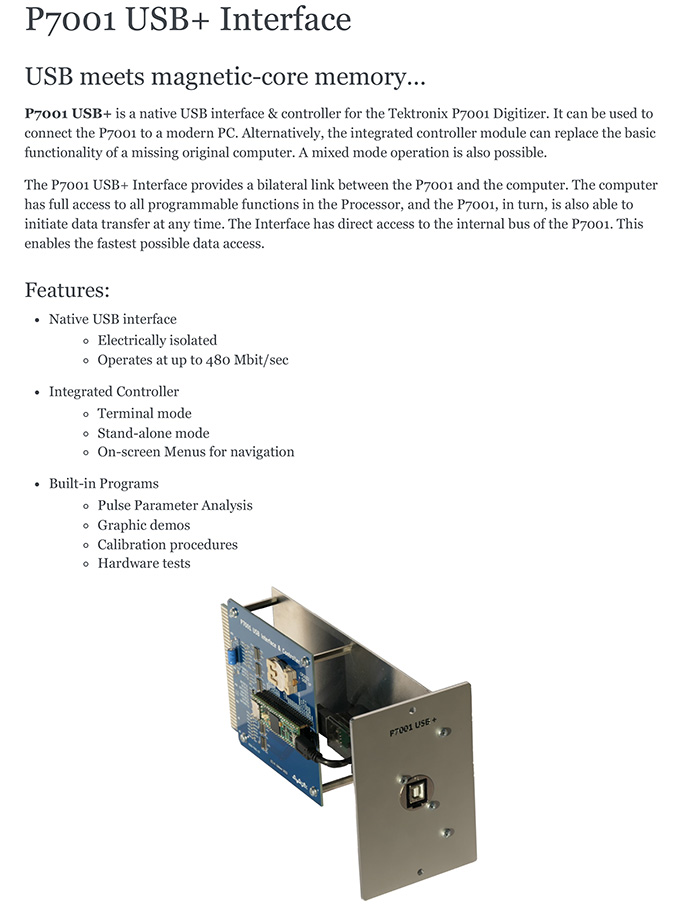
Here are his design documents. Click the link to view the PDFs.
He has made a couple of short videos of his progress on this project.
P7001 & Teensy - demo of pulse parameter analysis [YouTube site]
Live FFT demo on a P7001 [YouTube site]